Welcome to
Farms Under Threat: The State of the States
Farms Under Threat provides actionable information on the location and quality of agricultural land, the threats posed by development, and state-level policies that can help protect farmland and ranchland. This first-of-its-kind assessment was created by American Farmland Trust and Conservation Science Partners to empower farmers, citizens, and policymakers to protect the agricultural land base. We invite you to explore the information presented here and then take action by advocating for farms and farmers in your county or state.
To begin exploring the maps and data, visit the Spatial Mapping, Policy Scorecard, or Call to Action sections of this site. For guidance on how to navigate these pages, click here.
For more information about this project and links to further resources, read on below.
Read our report to learn about our methods, findings, and recommendations.
About Farms Under Threat
Farms Under Threat is American Farmland Trust’s multi-year effort to document the extent, diversity, location, and quality of agricultural land in the continental U.S.—as well as the threats to this land from expanding commercial, industrial, and residential development. This spatial mapping analysis is coupled with an extensive analysis of six state policy responses to the forces that lead to agricultural land conversion: development pressure, weakened farm viability, and the challenges of transferring land to a new generation. By linking spatial findings to policy solutions, we hope to provide decision-makers with the information they need to take policy actions that protect and retain agricultural land for future generations of farmers and ranchers.
More information about the Farms Under Threat project is available on the project overview page.
About The State of the States
Our most recent report, The State of the States, provides unprecedented insight at the state, county, and even sub-county levels. American Farmland Trust and Conservation Science Partners analyzed agricultural land use, the quality of land for agricultural production, and development pressure on farmland and ranchland in each state in the conterminous U.S. (the lower 48 states; Alaska and Hawaii were excluded due to data limitations). American Farmland Trust also conducted in-depth research on six state policies and programs to develop the Agricultural Land Protection Scorecard for all 50 states.
Click to download the full report.
Visualizing the Threats: Findings from the Spatial Analyses
The spatial mapping analyses of agricultural land conversion provide unprecedented insights into the status and fate of American farmland:- From 2001-2016, 11 million acres of agricultural land were paved over, fragmented, or converted to uses that jeopardize agriculture, curtailing sustainable food production, economic opportunities, and the environmental benefits afforded by well-managed farmland and ranchland.
- Low-density residential (LDR) land use is a major threat to agricultural land, as shown by our pioneering analysis, which is the first nationwide attempt to spatially identify the impacts of distributed, large-lot housing development on the agricultural land base.
- Compounding these impacts, 4.4 million acres of Nationally Significant land were converted to UHD and LDR land uses—an area nearly the size of New Jersey. AFT developed the Nationally Significant farmland designation to identify the most productive, versatile, and resilient (PVR) land for sustainable food and crop production.
Assessing the Response: Results from the Policy Scorecard
The Agricultural Land Protection Scorecard shows how states have—or have not—responded to the threats of agricultural land conversion. We assessed six policy tools commonly used to protect farmland, support agricultural viability, and provide access to land:- Purchase of agricultural conservation easement (PACE) programs (aka Purchase of Development Rights) that permanently protect working farmland and ranchland,
- Land-use planning policies that manage growth and stabilize the land base,
- Property tax relief for agricultural land that improves farm and ranch profitability,
- Agricultural district programs that encourage landowners to form areas to protect farmland,
- Farm Link programsthat connect land seekers with landowners who want their land to stay in agriculture, and
- State leasing programs that make state-owned land available to farmers and ranchers.
The results of the Scorecard show that every state has taken steps to retain land for agriculture, but all could do more. Only New Jersey and Virginia have adopted the full suite of the programs we examined. And while Oregon stood out for its high score in planning, no state earned a perfect score for a single policy, much less a full suite of policies. We found coordination is key—especially between state and local governments. The leading states for high-policy response linked multiple programs and created frameworks to harness local efforts. But because it often is not visible, states have not yet recognized or responded to the impacts of LDR on agriculture. Addressing the threat and potential opportunities of LDR is a critical challenge for the coming decades.
Call to Action
There is no silver bullet to respond to the threats to agricultural land. The Call to Action provides guidance that can help every state enhance their response.
Since conversion is driven by several interrelated factors, states need to use multiple policy approaches to protect their vital agricultural resources. Choices will depend on the nature and extent of the threat, its underlying causes, each state’s policy framework, and public support.
States can take the following five high-level actions to secure their agricultural land base:
- Action 1: Analyze and Map Agricultural Land Trends and Conditions
- Action 2: Strengthen and/or Adopt a Suite of Coordinated Policies to Protect Farmland
- Action 3: Support Farm Viability and Access to Land for a New Generation of Farmers and Ranchers
- Action 4: Plan for Agriculture, Not Just Around It
- Action 5: Save the Best, but Don’t Forget the Rest
Further Resources
In addition to the interactive maps and policy scorecard data available on this site, there is a wealth of information available. The “Reports and Data” menu at the top of the page provides access to the following materials:
- The full report, Farms Under Threat: The State of the States
- The executive summary of the report
- State-specific summaries of findings from both the spatial mapping and the policy analysis
- Details of the policy analysis, including state policy scoresheets and the Agricultural Land Protection Scorecard
- Geospatial data layers from the spatial mapping analysis
- In-depth, technical information on our spatial analysis methods
- The recording of our release events
- Watch one of our 37 state-specific webinars
How to navigate this site
Disclaimer
American Farmland Trust makes no warranties as to the suitability of the data and information found here for any particular purpose or user. Data and information may not be used for any commercial purpose. The spatial data may be used as an informative inventory of agricultural land use, land quality, and specific types of conversion. The policy data may be used as an informative inventory of state policies and programs in their roles in retaining agricultural land, regardless of whether this is their stated purpose, and recognizing the difficulty of evaluating policies across 50 states. Please refer to the report and technical documentation for an explanation of the methods used to develop the data and the limitations of the data. For more information or suggestions regarding the data on this site, please contact AFT’s Farmland Information Center: www.farmlandinfo.org or (800) 370-4879.
Alaska and Hawaii are not represented because there was insufficient data to include them in the spatial analysis. Please select another state or tab.
National Findings
Development Threatens Agricultural Land
From 2001-2016, acres of agricultural land was developed or compromised.
- Urban and highly developed (UHD) land use, including commercial, industrial, and moderate-to-high-density residential areas.
- Low-density residential (LDR) land use, where scattered large lot development fragments the agricultural land base and limits production, marketing, and management options for the working farms and ranches that remain.
of conversion was to
UHD
of conversion was to
LDR
| TIMES MORE LIKELY |
Best Agricultural Land is Under Threat
We used our unique PVR index, which quantifies the productivity, versatility, and resiliency of agricultural land, to identify:
- best land, which has PVR values above the state median, and
- Nationally Significant land, which is the country’s best land for long-term production of food and other crops. % of agricultural land, or acres, falls in this category.*
Protecting high-PVR land is critical for the long-term sustainability of agriculture, yet from 2001-2016:
of best land were converted to UHD and LDR uses.
of Nationally Significant land were converted.
Disclaimer
American Farmland Trust makes no warranties as to the suitability of the data and information found here for any particular purpose or user. Data and information may not be used for any commercial purpose. The spatial data may be used as an informative inventory of agricultural land use, land quality, and specific types of conversion. The policy data may be used as an informative inventory of state policies and programs in their roles in retaining agricultural land, regardless of whether this is their stated purpose, and recognizing the difficulty of evaluating policies across 50 states. Please refer to the report and technical documentation for an explanation of the methods used to develop the data and the limitations of the data. For more information or suggestions regarding the data on this site, please contact AFT’s Farmland Information Center: www.farmlandinfo.org or (800) 370-4879.
Agricultural Land Protection Scorecard
The Agricultural Land Protection (ALP) Scorecard is a state-by-state analysis of policies and programs that address the loss of farmland to development. Intended to inform decision-making and legislative action, it assesses state actions, measures their performance, and highlights effective aspects of the following programs and policies:
- Purchase of agricultural conservation easement programs (PACE)
- Land-use planning and growth management
- Property tax relief for agricultural land
- Agricultural district programs
- Farm Link programs
- State leasing programs
We used quantitative and qualitative factors to compare approaches across 50 states. The results for each policy are summarized in the policy scoresheets. We rolled up the totals from each scoresheet to generate Policy Response Scores, which are presented in the ALP Scorecard and serve as an indicator of each state’s overall policy response. The map shows state Policy Response Scores by quartile.
Policy Response Scores by Quartile
Policy Scores
About the Policies and Programs
Select a policy from the drop down menu to learn more about the approach and the factors we used to evaluate it.
This table can be sorted by clicking on the column heading. The weights used to combine the scores are shown in the column headings.
Disclaimer
American Farmland Trust makes no warranties as to the suitability of the data and information found here for any particular purpose or user. Data and information may not be used for any commercial purpose. The spatial data may be used as an informative inventory of agricultural land use, land quality, and specific types of conversion. The policy data may be used as an informative inventory of state policies and programs in their roles in retaining agricultural land, regardless of whether this is their stated purpose, and recognizing the difficulty of evaluating policies across 50 states. Please refer to the report and technical documentation for an explanation of the methods used to develop the data and the limitations of the data. For more information or suggestions regarding the data on this site, please contact AFT’s Farmland Information Center: www.farmlandinfo.org or (800) 370-4879.
Call to Action
Our research shows that people act when changes to their landscape are visible. In this century, land use changes have been hard to see. As a result, compared to the 1980s and 1990s, states have done little to secure their agricultural land base. This is shortsighted.
While development trends always have peaks and valleys, and real estate bubbles always burst, the force and extent of the last decade’s decline was an anomaly—far below the rates from recessions dating back to the 1960s. Yet states still converted 11 million acres of agricultural land. According to the 2017 Census of Agriculture, this is slightly more than all the land used to grow fruits, nuts, and vegetables across the U.S. Even in uncertain economic times, it is urgent that states—especially states with high rates of conversion—step up to save their farmland and ranchland.
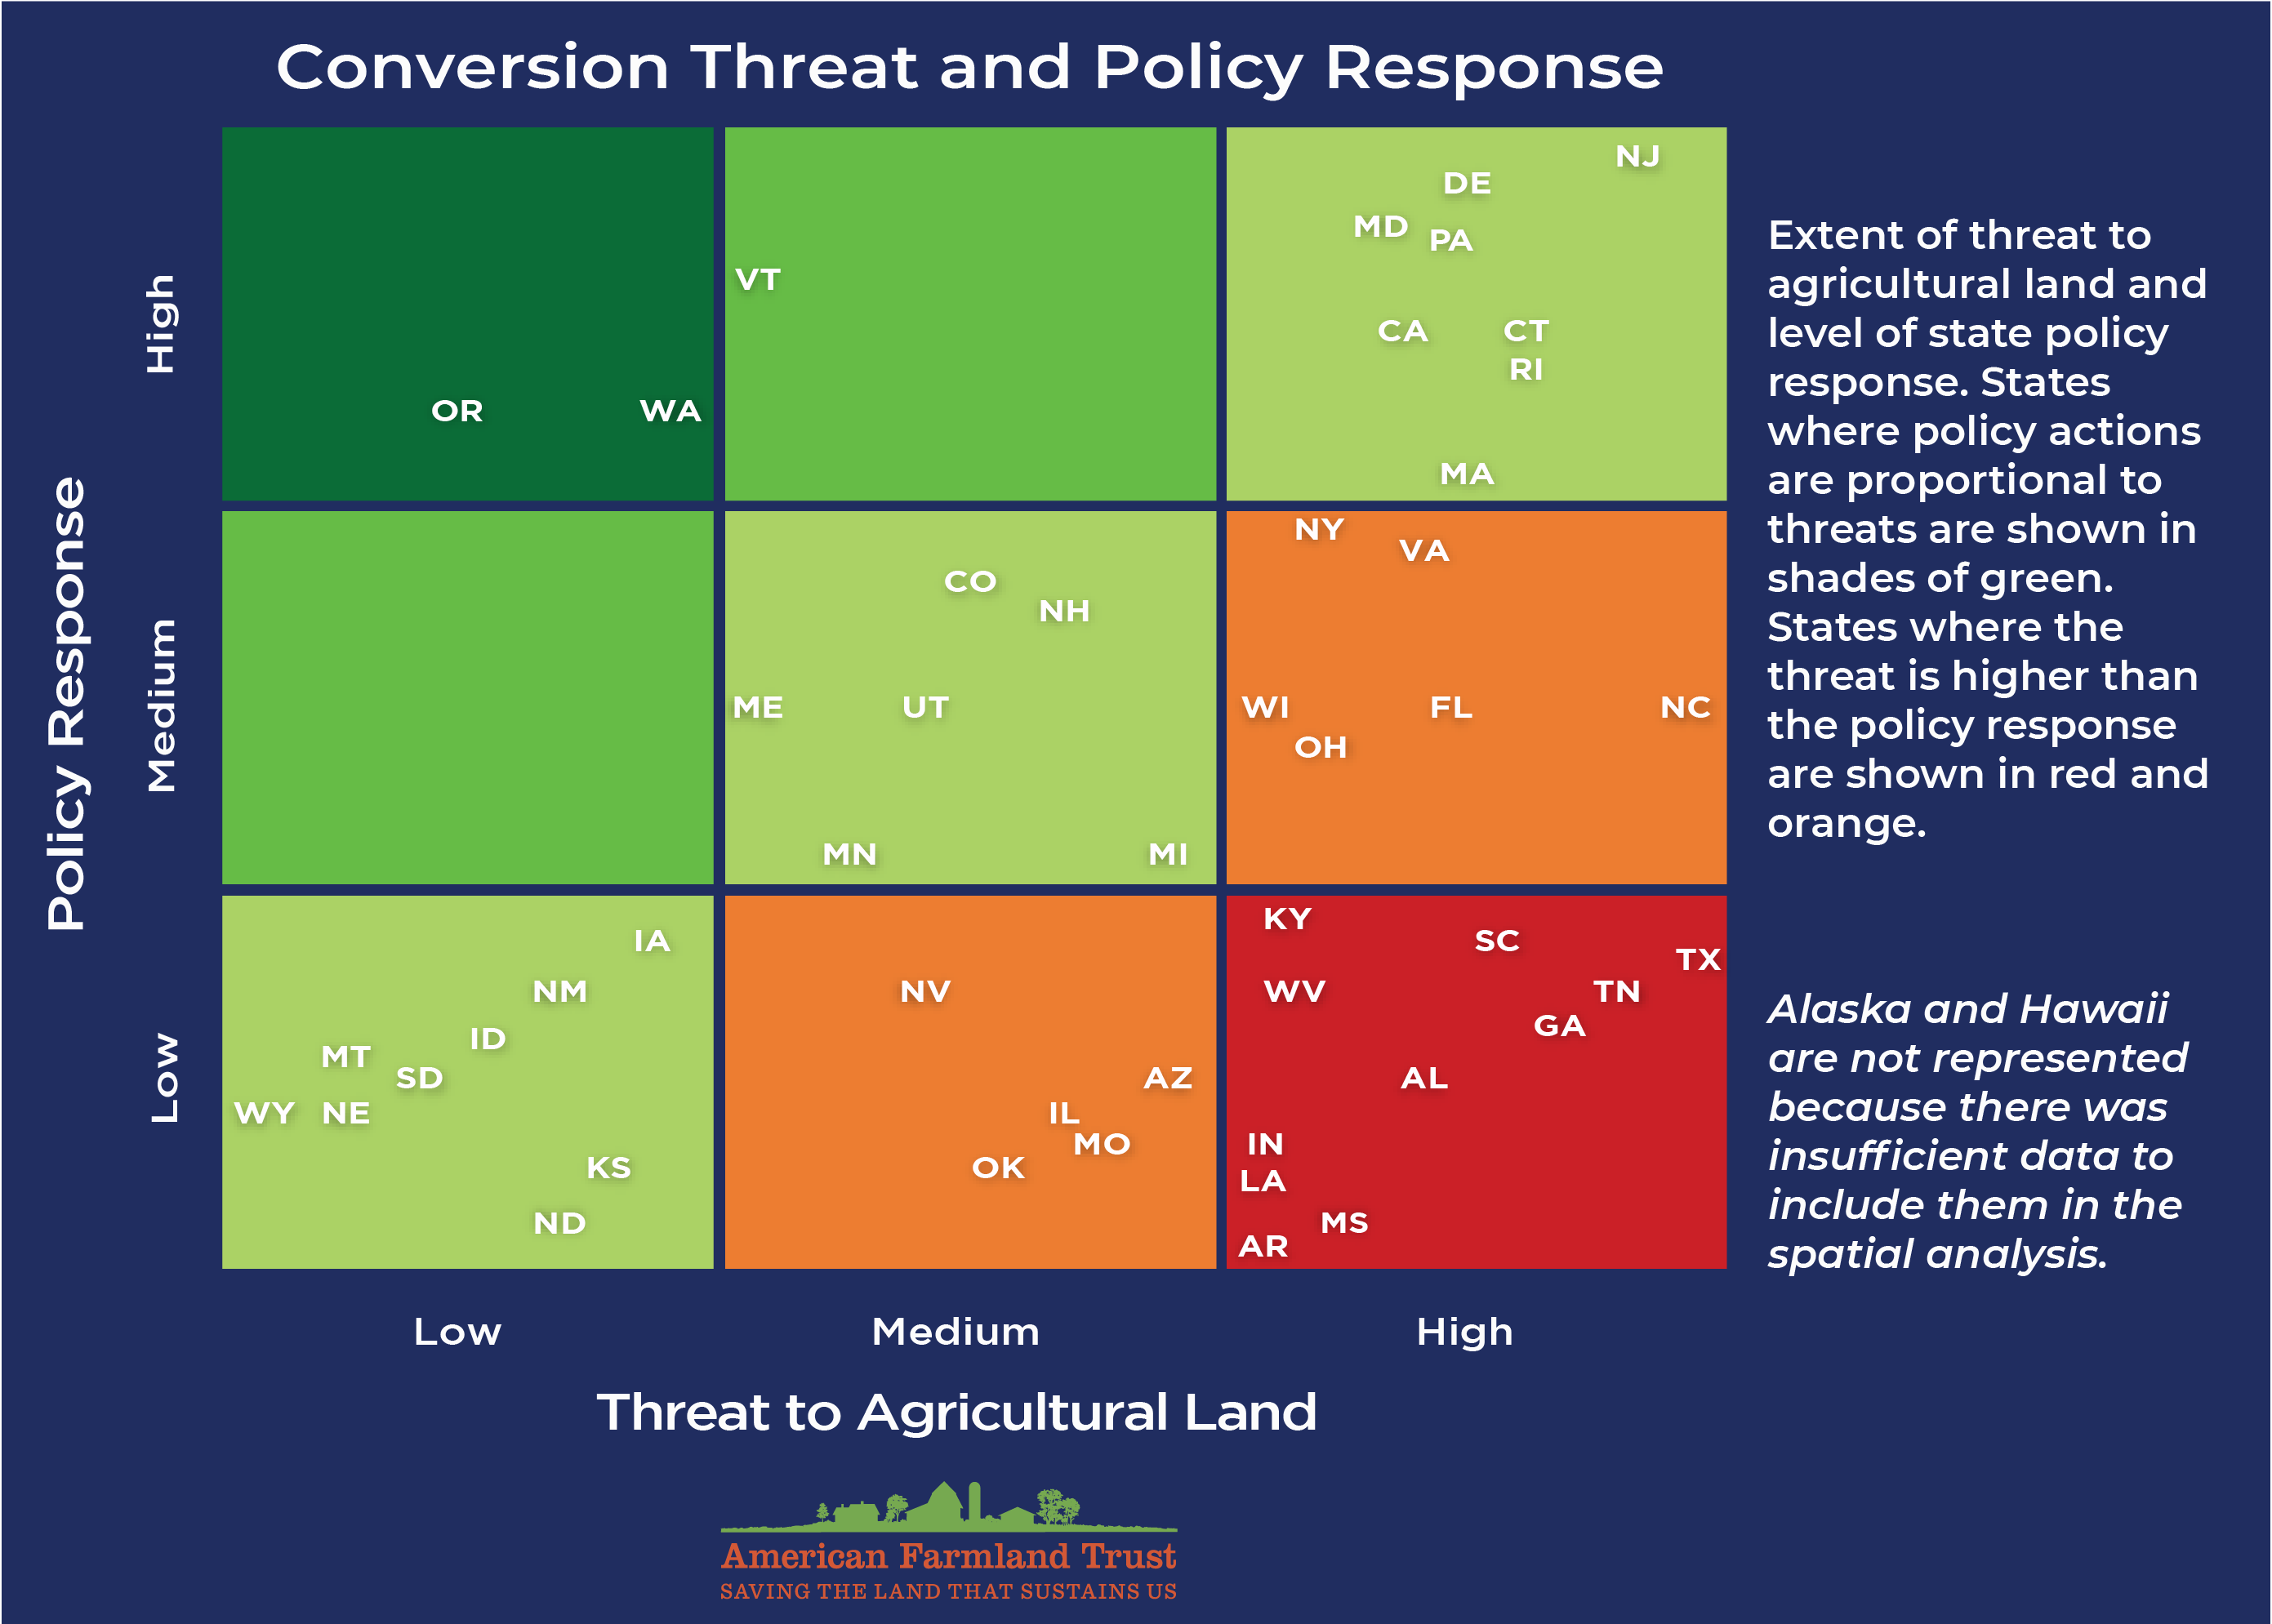
Of most concern are the high-threat states that have taken very little policy action. Led by Texas, most are in the South, but Indiana and West Virginia also fell into this category. States with a high threat and a reciprocally high policy response have worked for decades to address farmland loss. But even in cases of relatively wide policy adoption, they need to do more, better, faster—especially to address the spread of LDR.
What States Can Do
There is no silver bullet. Since conversion is driven by several interrelated factors, states need to use multiple policy approaches to protect their vital agricultural resources. Choices will depend on the nature and extent of the threat, its underlying causes, each state’s policy framework, and public support. What follows is a list of five high-level actions states can take to secure their agricultural land base.
Action 1: Analyze and Map Agricultural Land Trends and Conditions
Effective strategies are based on solid data. Toward that end, states should track agricultural land use trends and conditions, map their agricultural land, and conduct both state and local policy audits.
Action 2: Strengthen and/or Adopt a Suite of Coordinated Policies to Protect Farmland
States should address these trends and conditions with clear goals and a suite of coordinated policies. They can start by looking for opportunities within existing programs. While not always politically feasible, programs with regulatory teeth are more effective than those that rely on incentives alone. But if a regulatory approach is not achievable, states must offer strong enough incentives to have meaningful results.
Action 3: Support Farm Viability and Access to Land for a New Generation of Farmers and Ranchers
Competition for land drives up land values and prices, and a tight supply makes it hard for beginners and historically disadvantaged producers to enter the field. When farms and ranches consolidate or go out of business, it becomes harder for the remaining operations to thrive. The vital infrastructure that supports them also goes out of business or consolidates, making it more expensive and time consuming to obtain needed goods and services and to process, market, and distribute farm products. States need policies to support agricultural viability and to facilitate the transfer of land to a new, more diverse generation of farmers and ranchers.
Action 4: Plan for Agriculture, Not Just Around It
“A failure to plan is a plan to fail.” State and local governments plan for many things—from transportation and housing to health, safety, and economic wellbeing. Few plan for agriculture. This needs to change. Planning for agriculture establishes a public policy framework to support agricultural economic development as well as to retain and protect farmland for current and future generations. It can occur at state, regional, or local levels and result in a stand-alone plan or be included as part of a comprehensive or other type of plan, including sustainability and emergency management plans.
Action 5: Save the Best, but Don’t Forget the Rest
America’s agricultural landscape is extensive and diverse. Some is ideally suited to producing food, feed, and other crops; some is better suited to grazing livestock. All of it is important to state and local economies and to our food system. Nevertheless, states should make a special effort to protect their Nationally Significant land, which is critical for long-term food security and environmental quality. States can use the interactive maps on the Spatial Mapping tab to identify where their highest threats converge with their best quality agricultural lands. Working with local government partners, they can help ensure that local land use policies address the quality as well the quantity of their agricultural resources.
For more information, see the Call to Action section in the full report, Farms Under Threat: The State of the States. An explanation of how we constructed the above figure comparing conversion threat and policy response can be found here.